
Cloud computing has changed the way businesses build and manage applications. Instead of relying on physical servers in one location, organizations now run websites, databases, applications, and services across cloud platforms like Amazon Web Services (AWS), Microsoft Azure, and Google Cloud Platform (GCP). While this brings flexibility and scalability, it also creates a new challenge: keeping everything running smoothly.
This is where cloud monitoring tools become essential.
Imagine running an online store that suddenly becomes unavailable during a major sale. Customers cannot place orders, revenue drops, and your reputation suffers. Often, these problems begin with small warning signs such as high CPU usage, increasing response times, or storage nearing capacity. Without monitoring, these issues can go unnoticed until they become serious.
Cloud monitoring tools continuously watch your cloud infrastructure, applications, networks, and services. They collect performance data, generate alerts, and provide detailed insights that help teams identify and resolve problems before users notice them.
Whether you’re a small business owner, developer, IT administrator, or someone learning cloud computing, understanding cloud monitoring is one of the most valuable skills you can develop. This guide explains everything in simple language, including how cloud monitoring works, the best cloud monitoring tools, their benefits, challenges, practical examples, and tips for choosing the right solution.
What Are Cloud Monitoring Tools?
Cloud monitoring tools are software platforms that continuously track the health, performance, availability, and security of cloud-based resources. They collect data from servers, virtual machines, containers, databases, applications, storage systems, APIs, and networks.
Instead of manually checking dozens or hundreds of cloud resources, these tools automatically gather metrics and present them through dashboards, reports, and alerts.
For example, suppose your company hosts an eCommerce website on AWS. During a holiday sale, website traffic suddenly doubles. A cloud monitoring tool detects increased CPU utilization and memory consumption before the server reaches its limit. It automatically sends an alert, allowing your team to scale resources before customers experience slow loading times.
Without monitoring, administrators often discover problems only after customers complain.
Cloud monitoring tools generally track:
- CPU usage
- Memory usage
- Disk utilization
- Network traffic
- Application response time
- API performance
- Database health
- Storage capacity
- Error rates
- User activity
- Security events
- Availability and uptime
Most modern monitoring platforms also include visualization dashboards, predictive analytics, anomaly detection, automated alerts, and historical reporting.
Rather than replacing IT teams, these tools help them make faster, more informed decisions using real-time data.
Why Cloud Monitoring Matters
As businesses increasingly depend on cloud infrastructure, system reliability becomes critical. Even a few minutes of downtime can lead to lost revenue, frustrated customers, and damaged trust.
Cloud environments are dynamic. Resources are constantly being created, scaled, updated, and removed. Manual monitoring simply cannot keep pace.
Cloud monitoring provides continuous visibility into every component of your environment.
Some of its biggest advantages include:
- Detecting issues before they become outages
- Improving application performance
- Reducing downtime
- Optimizing cloud costs
- Enhancing customer experience
- Supporting compliance requirements
- Strengthening security monitoring
- Simplifying troubleshooting
Consider a SaaS company serving thousands of customers worldwide. If database queries suddenly become slower, users may notice delays when logging in or saving data. A monitoring tool immediately identifies increased database latency, alerts administrators, and helps pinpoint the root cause.
Instead of spending hours investigating, engineers can resolve the issue in minutes.
This proactive approach saves money, protects customer satisfaction, and improves overall operational efficiency.
How Cloud Monitoring Tools Work
Although different platforms offer unique features, most cloud monitoring tools follow a similar process.
Step 1: Collect Data
Monitoring agents or APIs gather information from cloud resources.
This includes:
- Servers
- Containers
- Databases
- Applications
- Virtual machines
- Storage
- Network devices
Some cloud-native services also expose monitoring data directly without installing additional software.
Step 2: Analyze Metrics
The collected information is processed to identify trends, abnormalities, and performance changes.
Examples include:
- CPU consistently above 90%
- Memory leaks
- Network congestion
- Slow database queries
- Increasing application errors
Step 3: Generate Alerts
When predefined thresholds are exceeded, alerts are sent through:
- SMS
- Slack
- Microsoft Teams
- PagerDuty
- Mobile apps
Immediate notifications help engineers respond quickly.
Step 4: Visualize Data
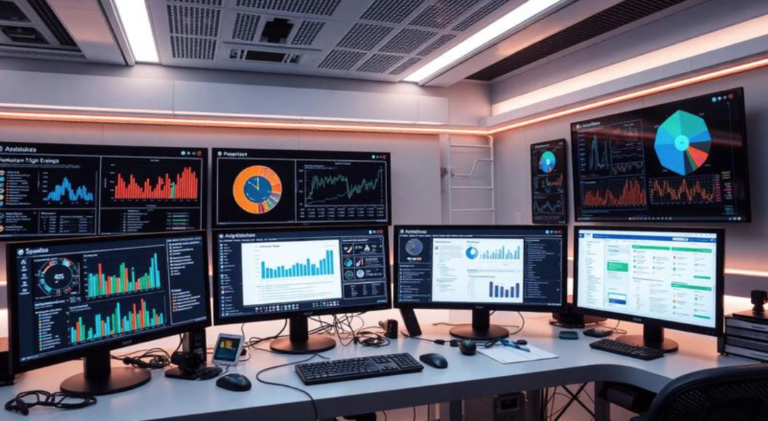
Dashboards transform complex metrics into graphs and charts that make system health easier to understand.
Historical reports help identify recurring issues and long-term performance trends.
Step 5: Support Troubleshooting
Many platforms correlate logs, metrics, and traces to help teams quickly locate the root cause of problems.
Instead of searching multiple systems, engineers see all relevant information in one place.
Types of Cloud Monitoring
Cloud monitoring covers multiple areas because modern cloud environments consist of many interconnected services.
Infrastructure Monitoring
Infrastructure monitoring focuses on virtual machines, servers, CPUs, memory, storage, and networking.
It ensures cloud resources remain healthy and available.
Application Performance Monitoring (APM)
APM measures how applications perform from the user’s perspective.
It tracks:
- Response time
- Errors
- Transactions
- User requests
- Service dependencies
This helps developers optimize application performance.
Network Monitoring
Network monitoring watches bandwidth, packet loss, latency, and traffic flow.
It helps identify bottlenecks and connectivity problems.
Database Monitoring
Databases often become performance bottlenecks.
Monitoring tools analyze:
- Query execution time
- Connection count
- Storage usage
- Replication health
- Slow queries
Log Monitoring
Applications generate large amounts of logs every day.
Log monitoring centralizes these logs, making troubleshooting much easier.
Security Monitoring
Security monitoring detects:
- Unauthorized access
- Suspicious activity
- Failed login attempts
- Malware indicators
- Compliance violations
Many organizations combine cloud monitoring with security information and event management (SIEM) solutions.
Best Cloud Monitoring Tools
There is no single “best” monitoring tool for every business. The right choice depends on your infrastructure, budget, and technical requirements.
1. Amazon CloudWatch
Amazon CloudWatch is AWS’s native monitoring solution.
Best for:
- AWS infrastructure
- EC2 monitoring
- Lambda functions
- Cloud-native applications
Pros:
- Deep AWS integration
- Automatic metric collection
- Custom dashboards
- Event automation
Cons:
- Less suitable for multi-cloud environments.
2. Microsoft Azure Monitor
Azure Monitor provides comprehensive monitoring for Azure resources.
Features include:
- Performance metrics
- Log analytics
- Alerts
- Application Insights
- Dashboards
Ideal for businesses heavily invested in Microsoft Azure.
3. Google Cloud Monitoring
Google Cloud Monitoring offers detailed visibility into GCP environments.
It supports:
- Kubernetes
- Compute Engine
- Databases
- Containers
- Custom metrics
Excellent for organizations using Google Cloud services.
4. Datadog
Datadog is one of the most popular third-party cloud monitoring platforms.
It supports:
- AWS
- Azure
- Google Cloud
- Kubernetes
- Docker
- On-premises servers
Strengths:
- Excellent dashboards
- APM
- Log management
- Infrastructure monitoring
- Security monitoring
Suitable for businesses managing hybrid and multi-cloud environments.
5. New Relic
New Relic specializes in application performance monitoring.
It provides:
- Distributed tracing
- Error tracking
- Infrastructure monitoring
- Browser monitoring
- Mobile monitoring
Developers appreciate its detailed performance analysis.
6. Prometheus
Prometheus is an open-source monitoring system widely used with Kubernetes.
Advantages:
- Free
- Highly customizable
- Strong community support
- Excellent metrics collection
Requires more technical knowledge compared to commercial tools.
7. Grafana
Grafana is primarily a visualization platform but integrates with many monitoring systems.
It creates beautiful dashboards using data from:
- Prometheus
- InfluxDB
- Elasticsearch
- CloudWatch
- Azure Monitor
Many organizations combine Grafana with Prometheus.
Key Features to Look for in Cloud Monitoring Tools
Choosing monitoring software involves more than comparing prices. A good platform should help your team detect issues early, investigate problems efficiently, and support future growth.
Important features include:
- Real-time monitoring
- Automated alerts
- Custom dashboards
- Historical reporting
- AI-based anomaly detection
- Log management
- Application performance monitoring
- Distributed tracing
- Multi-cloud support
- API integrations
- Security monitoring
- Scalability
- Cost reporting
The best monitoring solution balances functionality with ease of use. Small businesses may value simplicity, while larger enterprises often require advanced automation and analytics.
Benefits of Using Cloud Monitoring Tools
Cloud monitoring delivers advantages beyond simply detecting outages.
Organizations commonly experience:
- Faster incident response
- Higher uptime
- Better customer satisfaction
- Improved resource utilization
- Lower infrastructure costs
- Easier capacity planning
- Increased operational visibility
- Stronger security posture
- Better compliance reporting
- Improved collaboration between development and operations teams
For example, one software company noticed its cloud costs increasing every month. Monitoring revealed several virtual machines running continuously despite being used only during business hours. Scheduling automatic shutdowns reduced monthly cloud expenses without affecting productivity.
Common Challenges of Cloud Monitoring
Monitoring cloud environments is not without difficulties.
Large organizations often generate millions of metrics every day. Managing this data requires thoughtful planning.
Common challenges include:
Alert Fatigue
Too many notifications can cause teams to ignore important alerts.
Solution:
Use intelligent thresholds and prioritize critical alerts.
Multi-Cloud Complexity
Organizations using AWS, Azure, and GCP simultaneously need unified visibility.
Solution:
Choose platforms supporting multiple cloud providers.
Cost Management
Monitoring itself can become expensive as environments grow.
Solution:
Collect only meaningful metrics and archive older data efficiently.
Skill Gaps
Advanced monitoring platforms require training.
Solution:
Start with core features and gradually adopt advanced capabilities.
Common Mistakes to Avoid
Many organizations install monitoring software but fail to use it effectively.
Avoid these mistakes:
- Monitoring only infrastructure while ignoring applications.
- Setting unrealistic alert thresholds.
- Never reviewing historical trends.
- Ignoring storage growth.
- Forgetting log monitoring.
- Not testing alerts regularly.
- Collecting excessive metrics without clear objectives.
- Failing to document incident response procedures.
Monitoring works best when combined with regular reviews and continuous improvement.
Real-World Example
Imagine a growing video streaming company running its platform across multiple cloud regions.
During peak evening hours, users begin reporting buffering issues.
The monitoring platform detects:
- Increased CPU usage
- Rising database response times
- Network latency spikes
- Higher application error rates
Dashboards immediately highlight the affected services, while automated alerts notify engineers.
After investigating, the team discovers that one database cluster has reached capacity. Additional resources are provisioned, traffic is redistributed, and performance returns to normal within minutes.
Without cloud monitoring, identifying the root cause could have taken hours, leading to a much larger service disruption.
How to Choose the Right Cloud Monitoring Tool
Every organization has different priorities, so selecting the right platform requires evaluating both technical needs and long-term goals.
Ask yourself:
- Which cloud providers do you use?
- Do you need application monitoring?
- Is Kubernetes support required?
- How large is your infrastructure?
- What is your monitoring budget?
- Do you need AI-powered analytics?
- How important is ease of use?
- Does the tool integrate with your existing DevOps workflow?
Whenever possible, test a free trial before making a long-term commitment. Compare dashboard usability, alert quality, reporting features, and integration options rather than choosing solely based on price.
Practical Tips for Better Cloud Monitoring
To get the most value from cloud monitoring tools:
- Define clear performance goals.
- Monitor business-critical services first.
- Review dashboards daily.
- Configure meaningful alerts.
- Track long-term performance trends.
- Combine metrics with logs and traces.
- Remove unused cloud resources.
- Regularly update monitoring rules.
- Test disaster recovery procedures.
- Continuously optimize based on collected data.
Monitoring should evolve alongside your infrastructure.
External Authoritative Reference
Conclusion
Cloud monitoring tools have become a fundamental part of modern IT operations. As cloud environments grow more complex, relying on manual checks is no longer practical. Effective monitoring provides real-time visibility into infrastructure, applications, databases, and networks, allowing teams to identify issues before they affect users.
The right monitoring solution does more than send alerts. It helps optimize performance, reduce downtime, manage cloud costs, improve security, and support better business decisions. Whether you choose a cloud-native platform like Amazon CloudWatch, Azure Monitor, or Google Cloud Monitoring, or a third-party solution such as Datadog, New Relic, Prometheus, or Grafana, success depends on configuring meaningful metrics, reviewing trends regularly, and responding proactively.
Start with your most critical workloads, refine your monitoring strategy over time, and treat monitoring as an ongoing process rather than a one-time setup. A well-monitored cloud environment is more reliable, efficient, and ready to scale with your business.
Frequently Asked Questions
1. What are cloud monitoring tools?
Cloud monitoring tools are software solutions that monitor cloud infrastructure, applications, networks, and services to ensure they remain healthy, secure, and available.
2. Why is cloud monitoring important?
Cloud monitoring helps detect problems early, reduces downtime, improves application performance, controls cloud costs, and provides better visibility into system health.
3. Which cloud monitoring tool is best?
There is no universal best choice. AWS users often prefer Amazon CloudWatch, Azure users benefit from Azure Monitor, while Datadog and New Relic are popular for multi-cloud environments. Prometheus and Grafana are excellent open-source options.
4. What metrics should I monitor?
Important metrics include CPU usage, memory usage, storage, network traffic, response time, uptime, database performance, application errors, and security events.
5. Is cloud monitoring only for large businesses?
No. Even small businesses benefit from monitoring because it helps prevent downtime, improve performance, and reduce unnecessary cloud spending.
6. What’s the difference between cloud monitoring and application monitoring?
Cloud monitoring covers the entire infrastructure, including servers, storage, networking, and cloud services. Application monitoring focuses specifically on how software applications perform and how users experience them.
7. Can cloud monitoring improve security?
Yes. Many monitoring platforms detect unusual activity, failed login attempts, unexpected traffic patterns, and other indicators of potential security issues. While they are not full security platforms, they provide valuable visibility.
8. Are open-source cloud monitoring tools reliable?
Yes. Tools like Prometheus and Grafana are widely used in production by organizations of all sizes. They offer powerful capabilities but generally require more setup and maintenance than managed commercial solutions.